Every day, each of us makes a number of decisions and does a lot of things. Actions develop into habits, and habits in turn shape behavior and personality. Nathan Yau, a candidate for a PhD in Statistics at the University of California Los Angeles, became interested in the possibility of self-observation back in October 2008. Since then, his web service is Yours.FlowingData has become an original tool for users to collect and analyze data about themselves, build data visualizations. If desired, each person can share automatically generated report pages with everyone.
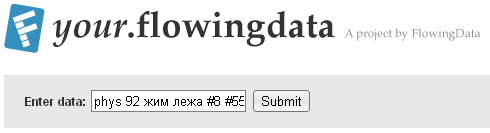
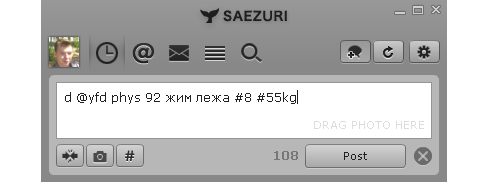
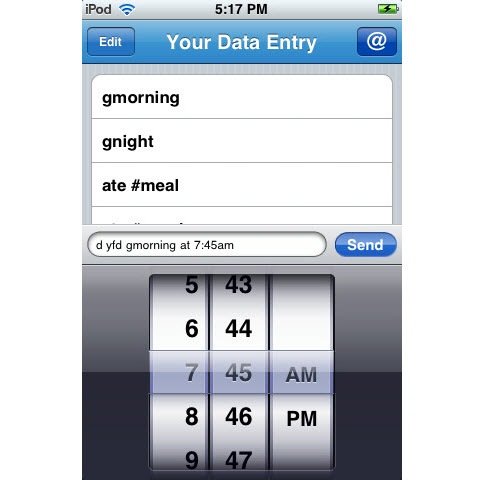
The essence of YFD's work is the collection of information by the user and the construction of reports by the web service using various data visualization methods. Registration on the web service is not required - logging in is done through your Twitter account. Next, a command of three components is introduced, and Your.FlowingData.com saves it in its database and builds bar charts, scatter charts and line graphs based on the data and time contained. The information is entered in several ways:
Each command contains the following components:
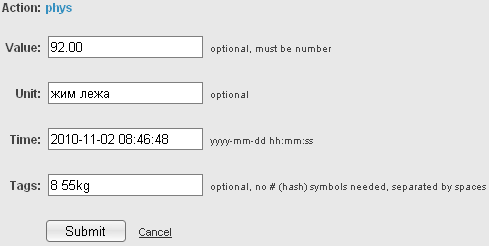
For example: eat Cheese #200gr. Action — eat, category of eaten – cheese, keywords — #200gr. If the data is entered incorrectly, you can edit the information at any time.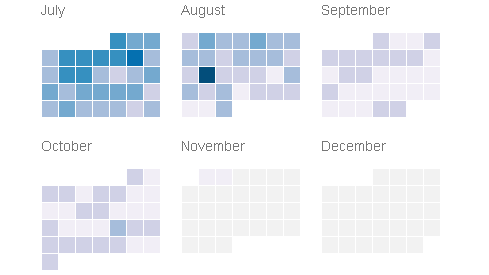
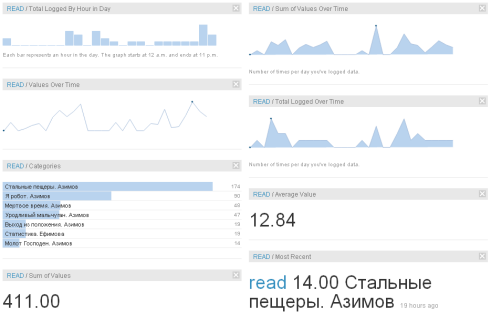
The page of each action displays frequently used categories and the time of day when they happen. Data visualization is also provided in the form of a calendar with a heat map (the color intensity shows the frequency of use of the category on a particular day), the number of entries by category, the number of subcategories and the keywords used are shown. When you click on any of the days, information about the actions performed and their categories is displayed. There is also filtering by categories and keywords of actions.
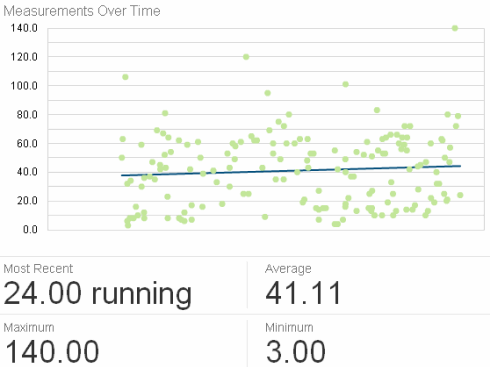
Each action can relate to one of the data types, according to which the corresponding graph or chart will be constructed. If in the previous example a vertical bar chart and a calendar with a heat map are constructed, then a dispersion diagram is constructed for the Measurement data type.
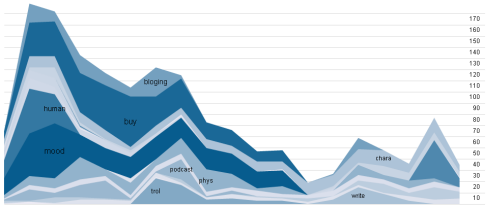
Timeline of time series. Present in every category. The volume of a phenomenon from the total mass is shown. The data is shown in detail by day, week, and month. The time frame in each phenomenon is selected in 7/30/90/365 days. Filtering by layers of actions is provided – the necessary increases in size, and the rest disappears from the screen.
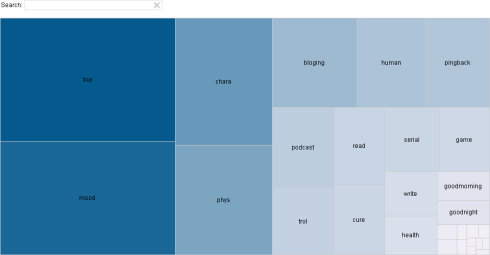
The set of actions can be represented both in the form of a “flat tree” and a tag cloud. Standard methods of data visualization. Nathan is original in another — experimental tools on time duration, cross-correlation between actions.
To summarize, it should be noted that Your.FlowingData is a very original web service. Together with its originality, it may be incomprehensible to most people. Your.FlowingData is designed for researchers who want to study their habits, adjust their lives and get better. The only requirement for using YFD is to develop the habit of collecting data about yourself.
Your.FlowingData